User Guide
convertToPolarImage and convertToCartesianImage are the two primary functions that make up this package. The two functions are opposites of one another, reversing the action that the other function does.
As the names suggest, the two functions convert an image from the cartesian or polar domain to the other domain with a given set of parameters. The power of these functions is that the user can specify the resulting image resolution, interpolation order, initial and final radii or angles and much much more. See the Reference Guide for more information on the specific parameters that are supported.
Since there are quite a few parameters that can be specified for the conversion functions, the class ImageTransform is created and returned from the convertToPolarImage or convertToCartesianImage functions (along with the converted image) that contains the arguments specified. The benefit of this class is that if one wants to convert the image back to another domain or convert points on either image to/from the other domain, they can simply call the functions within the ImageTransform class without specifying all of the arguments again.
Example 1
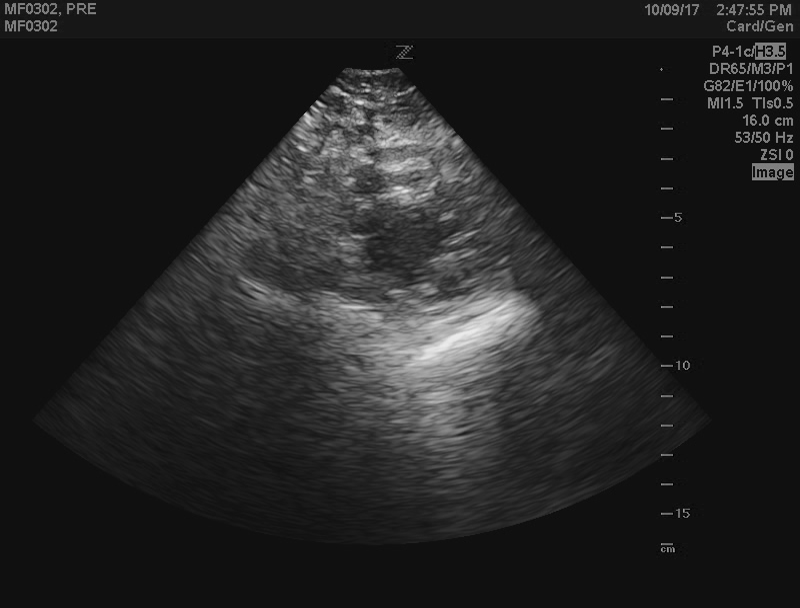
Let us take a B-mode echocardiogram and convert it to the polar domain. This is essentially reversing the scan conversion done internally by the ultrasound machine.
Here is the B-mode image:
import polarTransform
import matplotlib.pyplot as plt
import imageio
cartesianImage = imageio.imread('IMAGE_PATH_HERE')
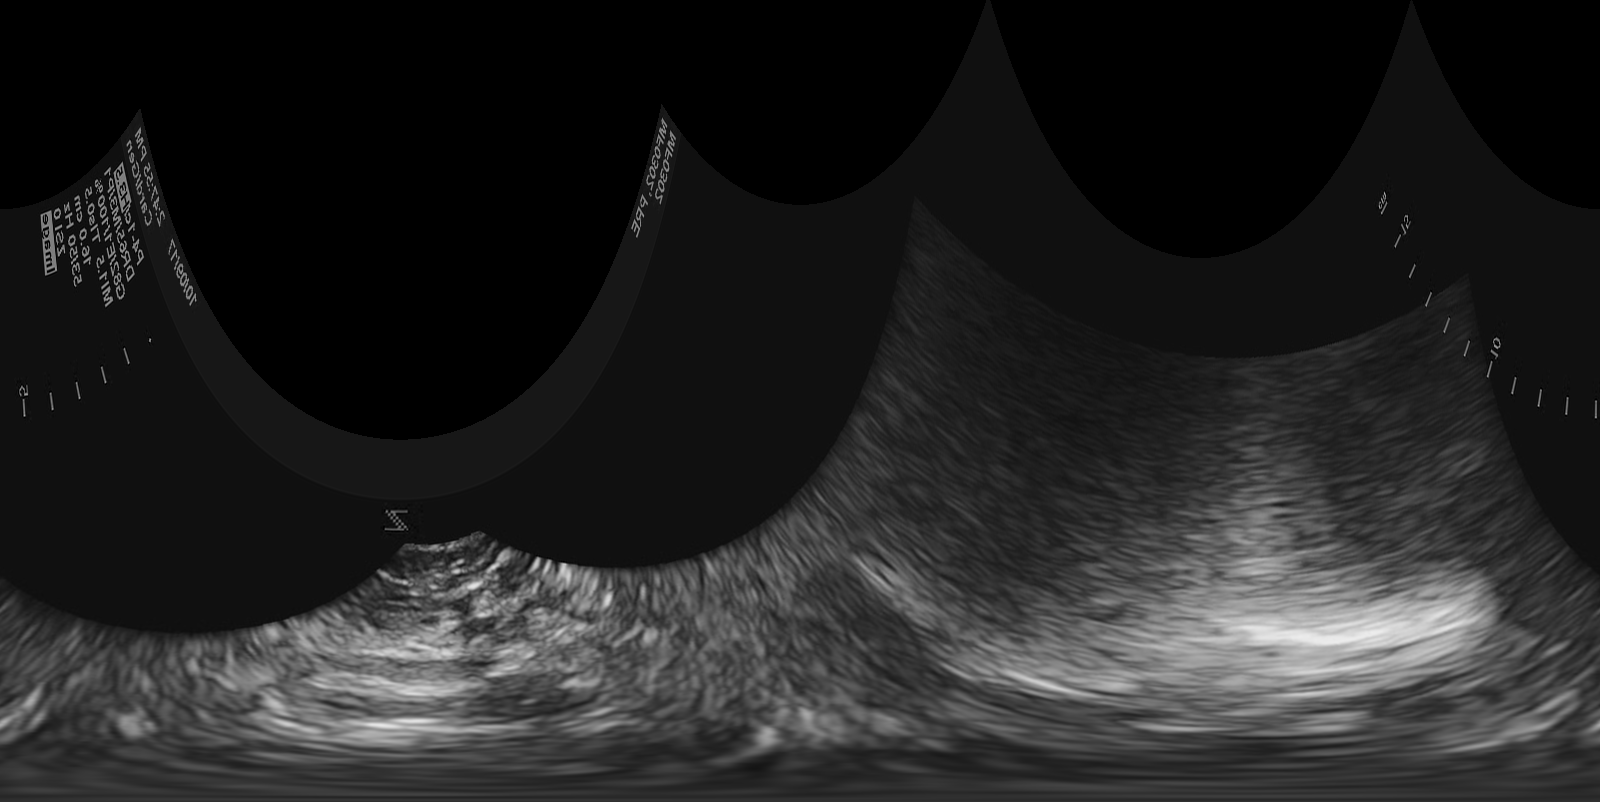
polarImage, ptSettings = polarTransform.convertToPolarImage(cartesianImage, center=[401, 365])
plt.imshow(polarImage, origin='lower')
Resulting polar domain image:
Example 2
Input image:

import polarTransform
import matplotlib.pyplot as plt
import imageio

verticalLinesImage = imageio.imread('IMAGE_PATH_HERE')

polarImage, ptSettings = polarTransform.convertToPolarImage(verticalLinesImage, initialRadius=30,
                                                            finalRadius=100, initialAngle=2 / 4 * np.pi,
                                                            finalAngle=5 / 4 * np.pi)

cartesianImage = ptSettings.convertToCartesianImage(polarImage)

plt.figure()
plt.imshow(polarImage, origin='lower')

plt.figure()
plt.imshow(cartesianImage, origin='lower')
Resulting polar domain image:

Converting back to the cartesian image results in: